

Introduction
When you’re running a virtualized environment, keeping the network smooth and steady is key—especially for apps that use UDP. Unlike TCP, UDP doesn’t bother with resending lost packets, so when something goes missing or arrives late, things can go sideways pretty fast. That’s a big deal for real-time stuff like VoIP, video calls… and yes, even faxing.
In one of the previous projects I worked on, we used fax servers running on virtual machines to handle fax transmissions over IP. Every now and then, we’d hit a wall—faxes just wouldn’t go through reliably. While regular VoIP calls can live with a bit of packet loss, faxing with G.711 (aka fax in-band) is way less forgiving. Even a tiny hiccup can mess things up.
So, we decided to dig in. Instead of sending actual faxes, we focused on a more general approach—simulating UDP traffic using various tools and measuring how well it traveled across the network. In this post, I’ll walk you through how we recreated the environment in a lab, the tools we used to troubleshoot, and the test scenarios we ran to explore how factors like CPU overload or network congestion can mess with transmission quality. Let’s get into it!
Understanding Packet Loss and Jitter in UDP Traffic
- Packet Loss: The failure of one or more transmitted packets to reach their destination. Causes include network congestion, CPU overload, or incorrect network settings.
- Jitter: Variability in packet arrival time. High jitter can disrupt real-time applications, leading to voice dropouts or failed fax transmissions.
- Why UDP is More Vulnerable: Since UDP does not implement retransmission, any lost packet is permanently missing, affecting data integrity.
G.711 vs. T.38 for Fax Transmission
- G.711 (Fax in-band): Uses uncompressed PCM audio to send fax data over IP, making it highly susceptible to packet loss and jitter. Any missing or delayed packets can corrupt the fax.
- T.38 (Fax over IP protocol): Converts faxes into a digital data stream, making it more resilient to network fluctuations. T.38 can retransmit lost packets, ensuring higher reliability.
Tools for Troubleshooting Packet Loss and Jitter
Windows-Based Tools:
- Ping: Basic network latency and packet loss testing (ping -t <destination>).
- Pathping: A combination of ping and tracert that helps identify packet loss points.
- Tracert: Traces network hops to locate latency sources.
- Netstat: Displays active network connections and potential socket issues.
Third-Party Tools:
- Wireshark: Captures and analyzes network packets for loss and jitter.
- iPerf: Measures UDP bandwidth, loss, and jitter (iperf -c <server> -u -b 1M -l 1400 -t 30).
- PSPing: Windows alternative to iPerf for latency and packet loss testing.
- Windows Performance Recorder (WPR): Collects low-level network and CPU metrics.
ESXi & vSphere Tools:
- esxtop: Monitors CPU, memory, and network performance.
- vmkping: Specialized ping tool for testing VMkernel network paths.
- pktcap-uw: A powerful built-in ESXi command-line tool for capturing network traffic at different levels (vSwitch, VMkernel, physical NIC). Useful for in-depth analysis of packet loss and jitter.
- vCenter Performance Charts: Provides historical network performance trends.
Test Scenarios
In this section, we will focus on practical test scenarios, and through them, we will introduce various tools. Instead of merely listing tools, we will introduce them organically through real-world use cases, applying them to obtain meaningful results.
Scenario 1: Baseline UDP Performance Test on ESXi
Goal: In our first scenario we would like to measure packet loss and jitter under normal conditions for UDP communication at the ESXi level.
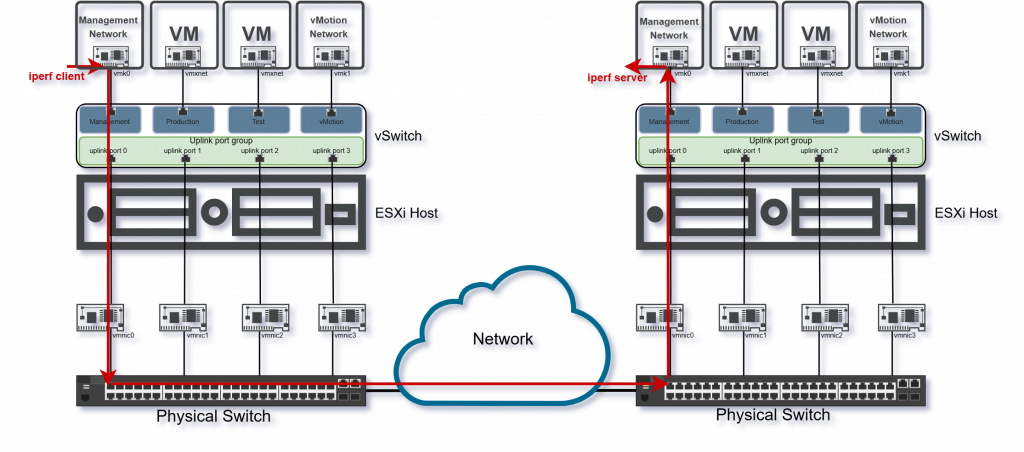
We are starting with iPerf. This is a widely used network performance testing tool that measures bandwidth, packet loss, jitter, and latency for both TCP and UDP traffic. It allows precise control over testing parameters, making it valuable for diagnosing network bottlenecks and ensuring optimal performance in virtualized environments.
The tool is already present on ESXi, but with security being hardened in ESXi 8, the method of using iPerf3 for network performance testing has changed a bit from the previous versions. Before, copying and renaming the iPerf3 binary was sufficient, but this approach is no longer working. However, there are still ways to utilize iPerf3 for testing between ESXi hosts or between an ESXi host and another device.
Method: Measure packet loss and jitter with iPerf3
- Step one: Issue the following commands on both server Host and client Host:
#esxcli network firewall set --enabled false
#localcli system settings advanced set -o /User/execInstalledOnly -i 0
#cp /usr/lib/vmware/vsan/bin/iperf3 /usr/lib/vmware/vsan/bin/iperf3.copy- Step two: Start iPerf server on one ESXi Host:
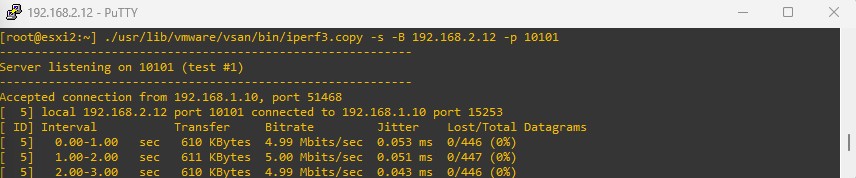
#cd /usr/lib/vmware/vsan/bin/
#./iperf3.copy -s -B <Bind-IP> -p <port> - Step three: Start iPerf client on the other ESXi Host:
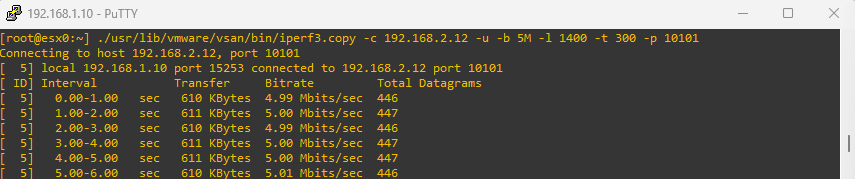
#cd /usr/lib/vmware/vsan/bin/
#./iperf3.copy -c <Server-IP> -u -b 10M -l 1400 -i 1 -t 300 -p <port>- Step four: When finish the tests, issue the commands to return to previous settings:
#localcli system settings advanced set -o /User/execInstalledOnly -i 1
#esxcli network firewall set --enabled true
iPerf – the most used options
| Option | Description |
|---|---|
| -i, –interval < t | f > | Sets the interval time in seconds between periodic bandwidth, jitter, and loss reports. If non-zero, a report is made every interval of the bandwidth since the last report. If zero, no periodic reports are printed. Default is zero. |
| -l, –len n[kmKM] | The length of buffers to read or write. |
| -u, –udp | Use UDP rather than TCP. |
| -B, –bind host[:port][%dev] | Bind to host one of this machine’s addresses. For the client, this sets the outbound interface. For a server, this sets the incoming interface. |
| -b, –bandwidth n[kmgKMG] | Set target bandwidth to n bits/sec (default 1 Mbit/sec) or n packets per sec. This may be used with TCP or UDP. Optionally, for variable loads, use format of mean,standard deviation |
| -P, –parallel | The number of simultaneous connections to make to the server. Default is 1. |
| -p, –port m[-n] | Set client or server port(s) to send or listen on per m (default 5001) w/optional port range per m-n (e.g. -p 6002-6008) |
| -t, –time n | The time in seconds to transmit for. iPerf normally works by repeatedly sending an array of len bytes for time seconds. Default is 10 seconds. |
| -f, –format | A letter specifying the format to print bandwidth numbers in. Supported formats are different for iPerf2 and iPerf3. |
| -J, –json | ONLY for iPerf3. Output in JSON format. |
Expected Outcome: This test will provide initial benchmark data on UDP packet loss and jitter under normal conditions. The results will serve as a reference point for comparison in later tests, allowing us to measure how CPU overload and network congestion impact network performance.

Line-by-Line Explanation
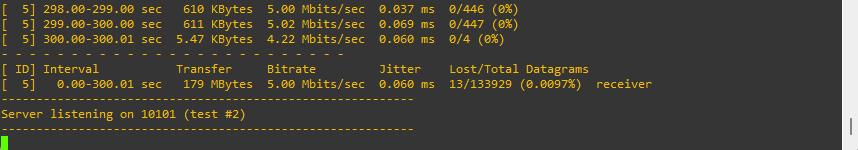
Interval
- 0.00-300.00 sec: The test ran for 300 seconds (5 minutes).
Transfer
- 179 MBytes: Amount of data sent during the test.
Bitrate
- 5.00 Mbits/sec: Requested 5 Mbps bandwidth (-b 5M if you ran the command).
- This means iperf3 sent UDP traffic at a constant rate of 5 Mbps.
Jitter
- 0.000 ms at sender (not meaningful here)
- 0.060 ms at receiver: Very low jitter, excellent for VoIP/fax quality.
Lost/Total Datagrams
- 0/133929 (0%) at sender: Sent all packets successfully.
- 13/133929 (0.0097%) at receiver: Lost only 13 packets over 300 seconds, which is extremely low — practically negligible.
Interpreting the Overall Result
| Metric | Status |
|---|---|
| Packet Loss | Excellent (less than 0.01%) |
| Jitter | Excellent (0.060 ms is very low) |
| Bandwidth Consistency | Stable at 5 Mbps |
| Usability for Fax (G.711) | ✅ Yes, should work reliably |
We’ll pause here for now and continue with the next test scenario in a follow-up post. Splitting the content into parts allows us to keep each topic focused and digestible, and hopefully a bit more fun to follow along with.
Conclusion
That wraps up our first test scenario! We’ve laid the groundwork with a basic performance check using iPerf on ESXi and now have a solid benchmark to compare against. But this is just the beginning. In the next part of this series, we’ll turn up the heat—literally—by simulating CPU overload and diving into how it affects packet flow. We’ll also put pktcap-uw to work and look even deeper into what’s happening under the hood.
So stay tuned—things are about to get a lot more interesting!
Pssst! Just a quick tip before you go — if you spend a lot of time online, using a VPN is one of the easiest ways to stay safe and private. I personally use NordVPN, and it’s been fast, reliable, and easy to use.
Check it out here – there’s a great deal available right now

This post contains affiliate links. If you buy something through one of them, I may earn a small commission at no extra cost to you. Thanks for the support!